As of today you can access your smart meter data programmatically using the PowerShaper Monitor API.
An Application Programmers Interface is a way of transferring data between two software systems automatically. You can use it to import data to other home energy systems (we have a Home Assistant integration in the pipeline) or to perform much more sophisticated analysis of the data in a spreadsheet application or a language like Python.
You can read the full PowerShaper Monitor API Documentation without needing a PowerShaper account. This includes short code samples in Python, cURL and JavaScript.
In this post I’m also going to show you how to download data using Python or import data into a Google Sheet or Excel. The Python and Google Sheets methods require some knowledge of coding to fully understand, or at least sufficient fearlessness to play around with it.
Jump ahead if you know what you’re looking for:
Basic Concepts
- Access token: In order to access the API you’ll need a unique access token, a sequence of letters and numbers that identifies you uniquely. You can find this in the ‘Settings’ page of your PowerShaper Monitor account.
-
Meter Consent: Each time you grant consent to access your meter(s) we generate a unique identifying code (referred to as
consent_uuid- universally unique identifier). If an electricity and a gas meter are both present at the point that this happens then this code applies to both of them. It’s entirely possible for two different users to gain access to the same meter (perhaps at different times after a house move) or for one user to have access to multiple electricity meters (if they have a second home, for instance). - Endpoints: these are the separate requests you can make to the API. At the moment there are two endpoints: “list meters” will request a list of the meters to which you have access, and “request usage records” will request your energy usage for a period. The results are returned in JavaScript Object Notation format (JSON - Wikipedia).
1. Excel
The latest versions of Excel have a “Get Data” facility which can be used to import data from web APIs like PowerShaper Monitor’s. Unfortunately this feature doesn’t seem to be present in Excel for Mac or the online Excel 365. Here’s how you go about using it.
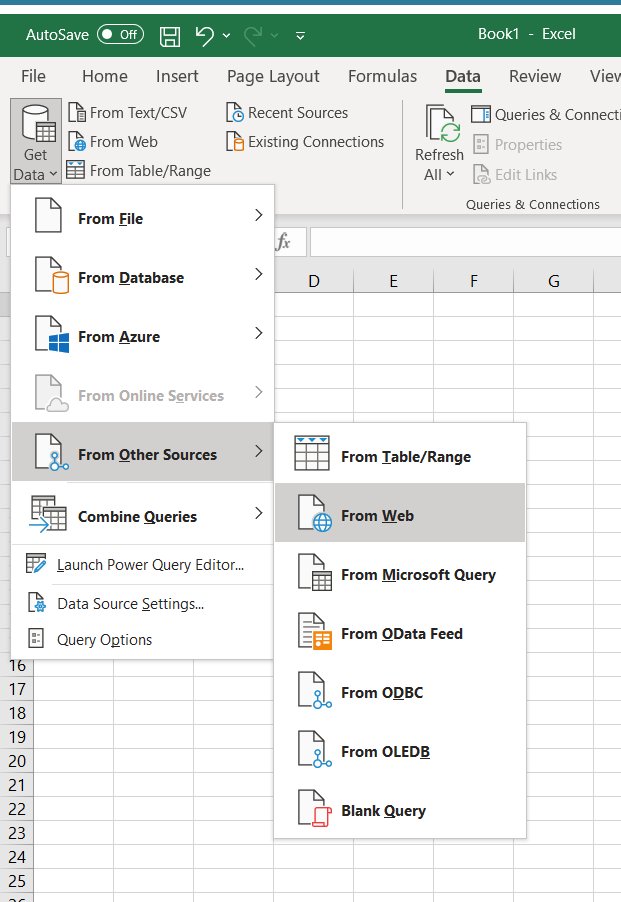
Bring up the dialogue by going to the Data ribbon menu, selecting “Get Data” and then “From Other Sources” … “From Web”.
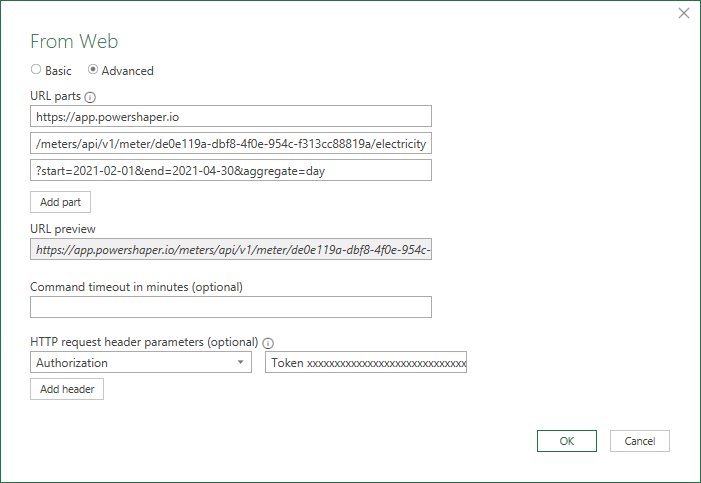
In the dialogue that appears, open the ‘Advanced’ options.
To call the ‘list meters’ endpoint, enter https://app.powershaper.io/meters/api/v1/meters/ (don’t miss off the final /) in the first URL parts input, and add a request parameter Authorization with a value of Token xxxxxxxxxxxxx where the xxxxxxxxx is the access token from your PowerShaper Monitor settings page.
It should look like this:

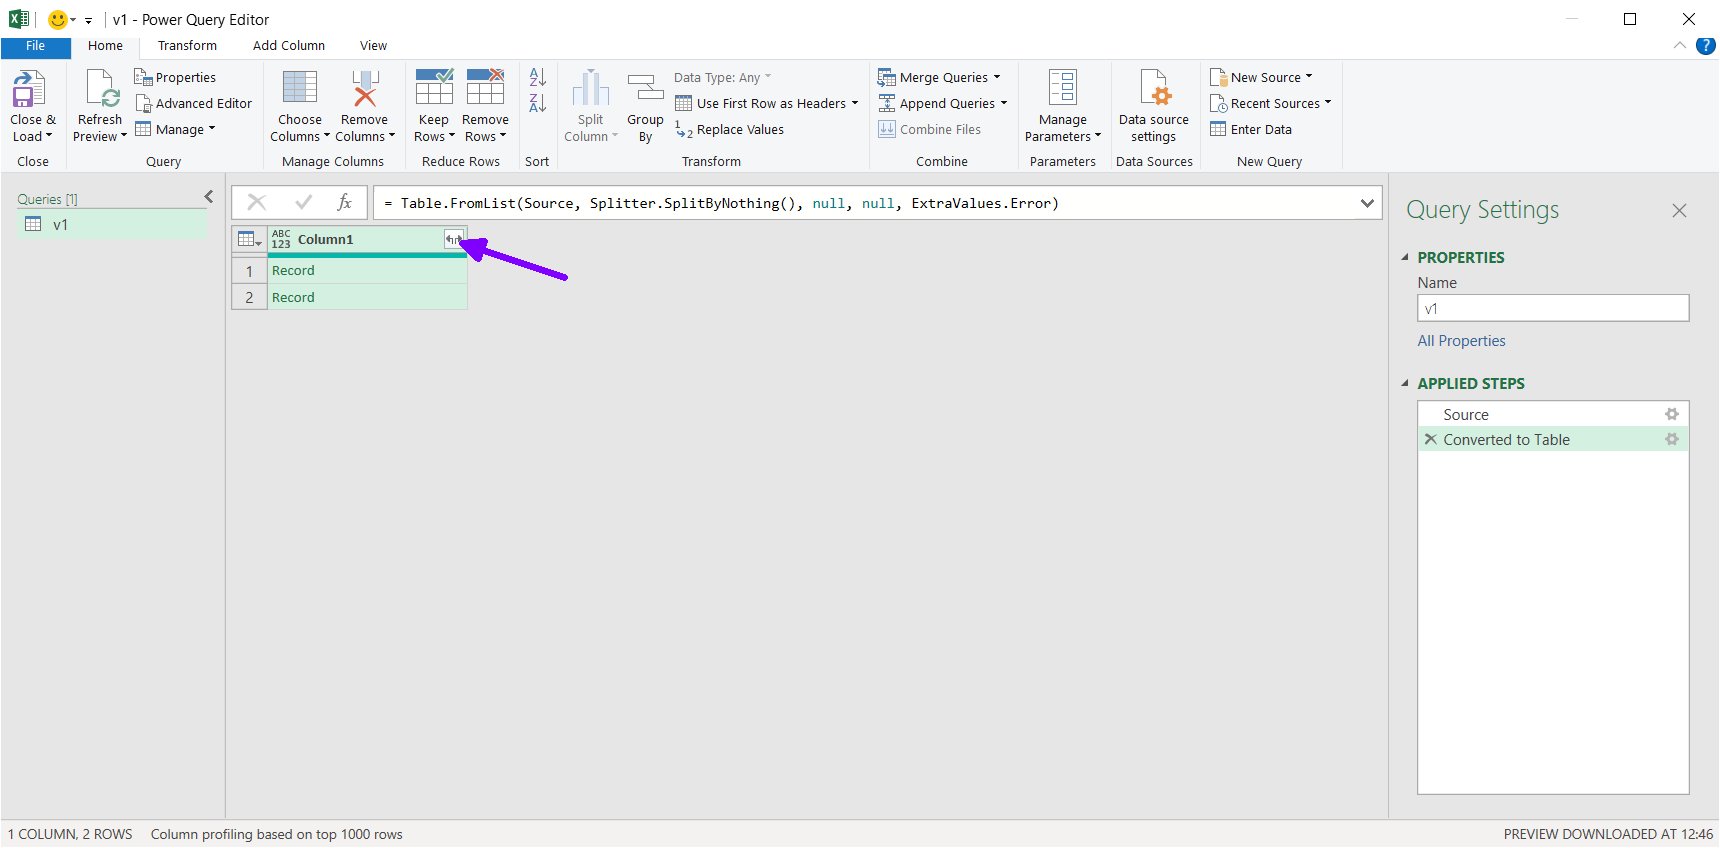
Click OK, and then confirm that you can make this request without needing authentication (“Use anonymous access for this Web Content”). Excel will open up the Query Power Editor. The simplest way to get the data we want out of this is to click “To Table” in the top left, accept the defaults and then click the button to expand Column1:
Open all the columns and you should see the data that’s been returned by the API call. Each row represents a meter to which you have access. The consent_uuid is the unique code for the consent, the type describes the meter type, and you will also see the last four digits of the MPAN, and the status. The range can be further expanded using the ![]() button in the header row to show the earliest and latest time periods for which we have data, and the
button in the header row to show the earliest and latest time periods for which we have data, and the links can be expanded to provide the endpoint that we need to make usage requests.
To save this into your current spreadsheet, click “Close and Load” in the top left.
Next we’ll make a basic request for daily total energy usage for one of these meters. Copy the contents of the links.records column into your clipboard and go back to to the Get Data … From Web dialogue. Paste the links.records column into the second URL part input and put https://app.powershaper.io into the first. Put your access token into an Authorization HTTP header again as before, and next click ‘Add part’ to add the query parameters into the URL. These define the data that you’re asking for. As you can see from the API documentation there are four possible parameters:
-
start- the first day for which you want data, specified in yyyy-mm-dd format (e.g. 2021-02-01 for Feb 1st 2021) -
end- the last day for which you want data, in the same format -
aggregate- use values ‘day’ or ‘month’ to report data as daily or monthly totals. You can set this to ‘none’ or simply omit the parameter to get halfhourly usage, or use the value ‘profile’ to get your average daily profile for each halfhour of the day over the period you have specified. -
tz(optional) - the timezone that you would like the usage reported in. If you don’t specify this you will get the results in the Europe/London timezone. If you want to do analysis in the UTC timezone which avoids daylight saving changes then add&tz=Etc/UTCto the end of the query parameters.
Each of these needs to be set in this final URL part input, separated with ampersands and starting with a question mark (this is called a URL encoded Query string - Wikipedia). So it should look like this:
You should get the Query Power Editor back again. Again click “To Table” and accept the defaults and expand Column1 and you should see your data: timestamp, energy consumed in kWh, associated carbon emissions in kg and also an error count which indicates how many halfhour periods are missing in this row (unfortunately missing data is a fact of life where there are as many links in a data chain as this!).
You can either Close and Load this data back over the previous data or click the down arrow and select “Close and Load to…” to put it to a different location in the same worksheet or a new worksheet in the same Excel file.
2. Google Sheets
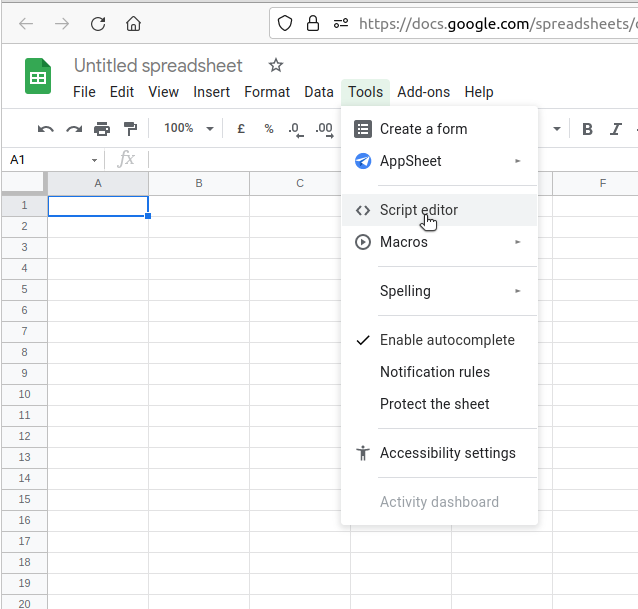
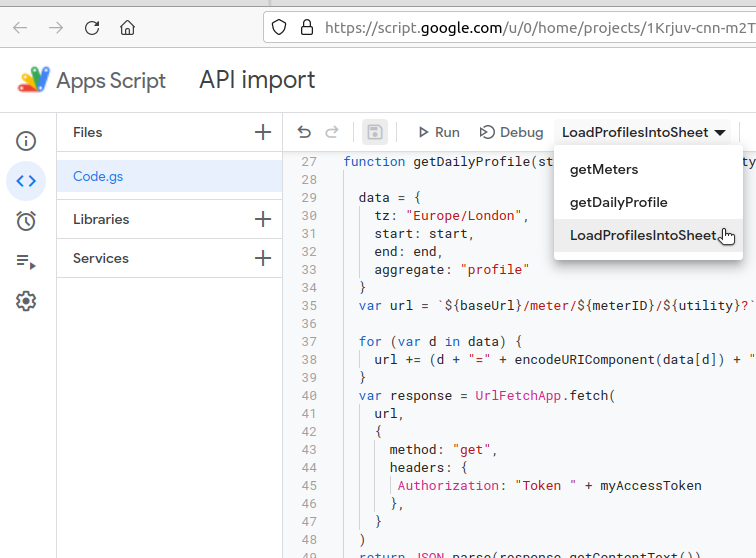
Google Sheets doesn’t have a dialogue-driven import facility like Excel but data can be brought in using the Google App Script scripting language, which is based on JavaScript. To get to this, open any Google Sheet and click Tools → Open Script Editor.
As a demonstration exercise, this short demo script will load two daily profiles into adjacent columns to allow them to be compared.
google-app-script-demo.txt (1.8 KB)
Copy-paste this into your script editor and replace the dummy access token in the first line of the script with your token from the PowerShaper Monitor Settings page.
There are three functions here - LoadProfilesIntoSheet() is the one that will do the work. Here’s what it does:
- First it calls
getMeters()to make the ‘list meters’ call, loading the result into the variablemeterList. - Next it takes the
consent_uuidfrom the first meter returned and uses thegetDailyProfile()function to call the ‘request usage records’ endpoint twice for the electricity meter associated with that UUID - once for the month of January and once for July. - Finally it loads the data into the active worksheet, first setting headers in the first row and then stepping through all the halfhours of the day (1-48) to output the data using
sheet.getRange(row_number,column_number).setValue(). The time is written into column A, the average usage for that halfhour in January into column B and the average July usage in column C.
You can run this function by selecting LoadProfilesIntoSheet from the dropdown list at the top of the script and then clicking Run.
The calls to the API are made with the UrlFetchApp class. To use the ‘request usage records’ endpoint, the query parameters are appended to the URL. The response is parsed as JSON to return an array of JavaScript objects that contain the attributes time, energy_kwh, carbon_kg and error_count.
The result of running the function should be something like this:

Now you have the data in the spreadsheet you can graph it and subject it to whatever analysis you wish. You can also fairly easily alter the LoadProfilesIntoSheet() function to pull the carbon emissions, or other periods or levels of aggregation and load them into different areas of the sheet. Refer to the for the PowerShaper Monitor API Documentation for the parameters you need to send.
3. Python
Python code samples are provided in the API documentation which should help you get at your data. If you’re having trouble understanding them you may find this small library useful:
api_demo.py (1.2 KB) (Requires Python 3)
Note that this is not a fully featured API library, just a short script to get you going. It contains a function to call each of the endpoints. You can either edit the script to include your access token or set it after importing the library. Here’s how you might use it:
Assuming you’re in a Python shell in the folder containing the script:
import api_demo
api_demo.access_token = "xxxxxxxxxxxxxxxxxxxxx" # if you didn't save it in the script already

meters = api_demo.get_meters()

# meters will now be populated with an array of dicts describing each meter you can access

# Let's look at the first meter in the list
first_meterconsent_uuid = meters[0]["consent_uuid"]

# Request the raw halfhourly electricity records for the first week of June
from datetime import datetime
usage_records = api_demo.get_usage_records(
    start=datetime(2021,6,1),
    end=datetime(2021,6,7),
    meter_id=first_meterconsent_uuid,
    utility="electricity",
    aggregate="none"
)
This is a very trivial demonstration of how the API allows you better access to your data that is possible with the web app alone, which does not display half-hourly data for periods longer than 6 days. Again, now you have the data you can subject it to all manner of analyses using Pandas or NumPy, or simply write it out to a CSV file to bring it into a spreadsheeting application.
In conclusion
We will continue to develop PowerShaper Monitor and we hope to see it integrated into other home energy systems over the coming months and years. The usefulness of your energy data is hugely increased when you can compare it with other information about your house - that might be knowing when you made a change to your behaviour or the appliances in your house, or weather data from an external data provider. We hope that having the flexible access to the data that an API provides will help you get more value out of it and we hope you will tell us all what you get up to with it!